Exposure to different analytical methods
Week-7 began with a quick recap on various research methods learned in the six weeks of NFLC classroom sessions. Neema emphasised the use of mixed methods such as observation, reflective field-notes, interviews, inventory mapping, survey, etc. to enrich the quality of research work. The gathered information could be qualitative or quantitative. Data analysis helps to consolidate all the collected information by representing it in a standard format using statistical tools/software. A presentation on basic statistical concepts like average/mean, frequency, percentage, maximum, minimum, range, median, mode, etc. was made. The presentation also included some of the do’s and don’ts along with representation of data using appropriate charts and/or graphs in Excel.
Students were briefed about the week’s schedule where they had to do a survey to study the travel behaviour of employees from Keystone, Last Forest, Aadimalai and NNHS. “Interviews have the flexibility to gather information with the respondents’ flow of thoughts, unlike surveys that narrow down responses to limited options.” Then, why a survey than an interview – asked one of the students. One of the teaching team clarified by saying given the short-span of time, the former is time-saving and goal-specific, while the latter needs more time and can open up more questions.
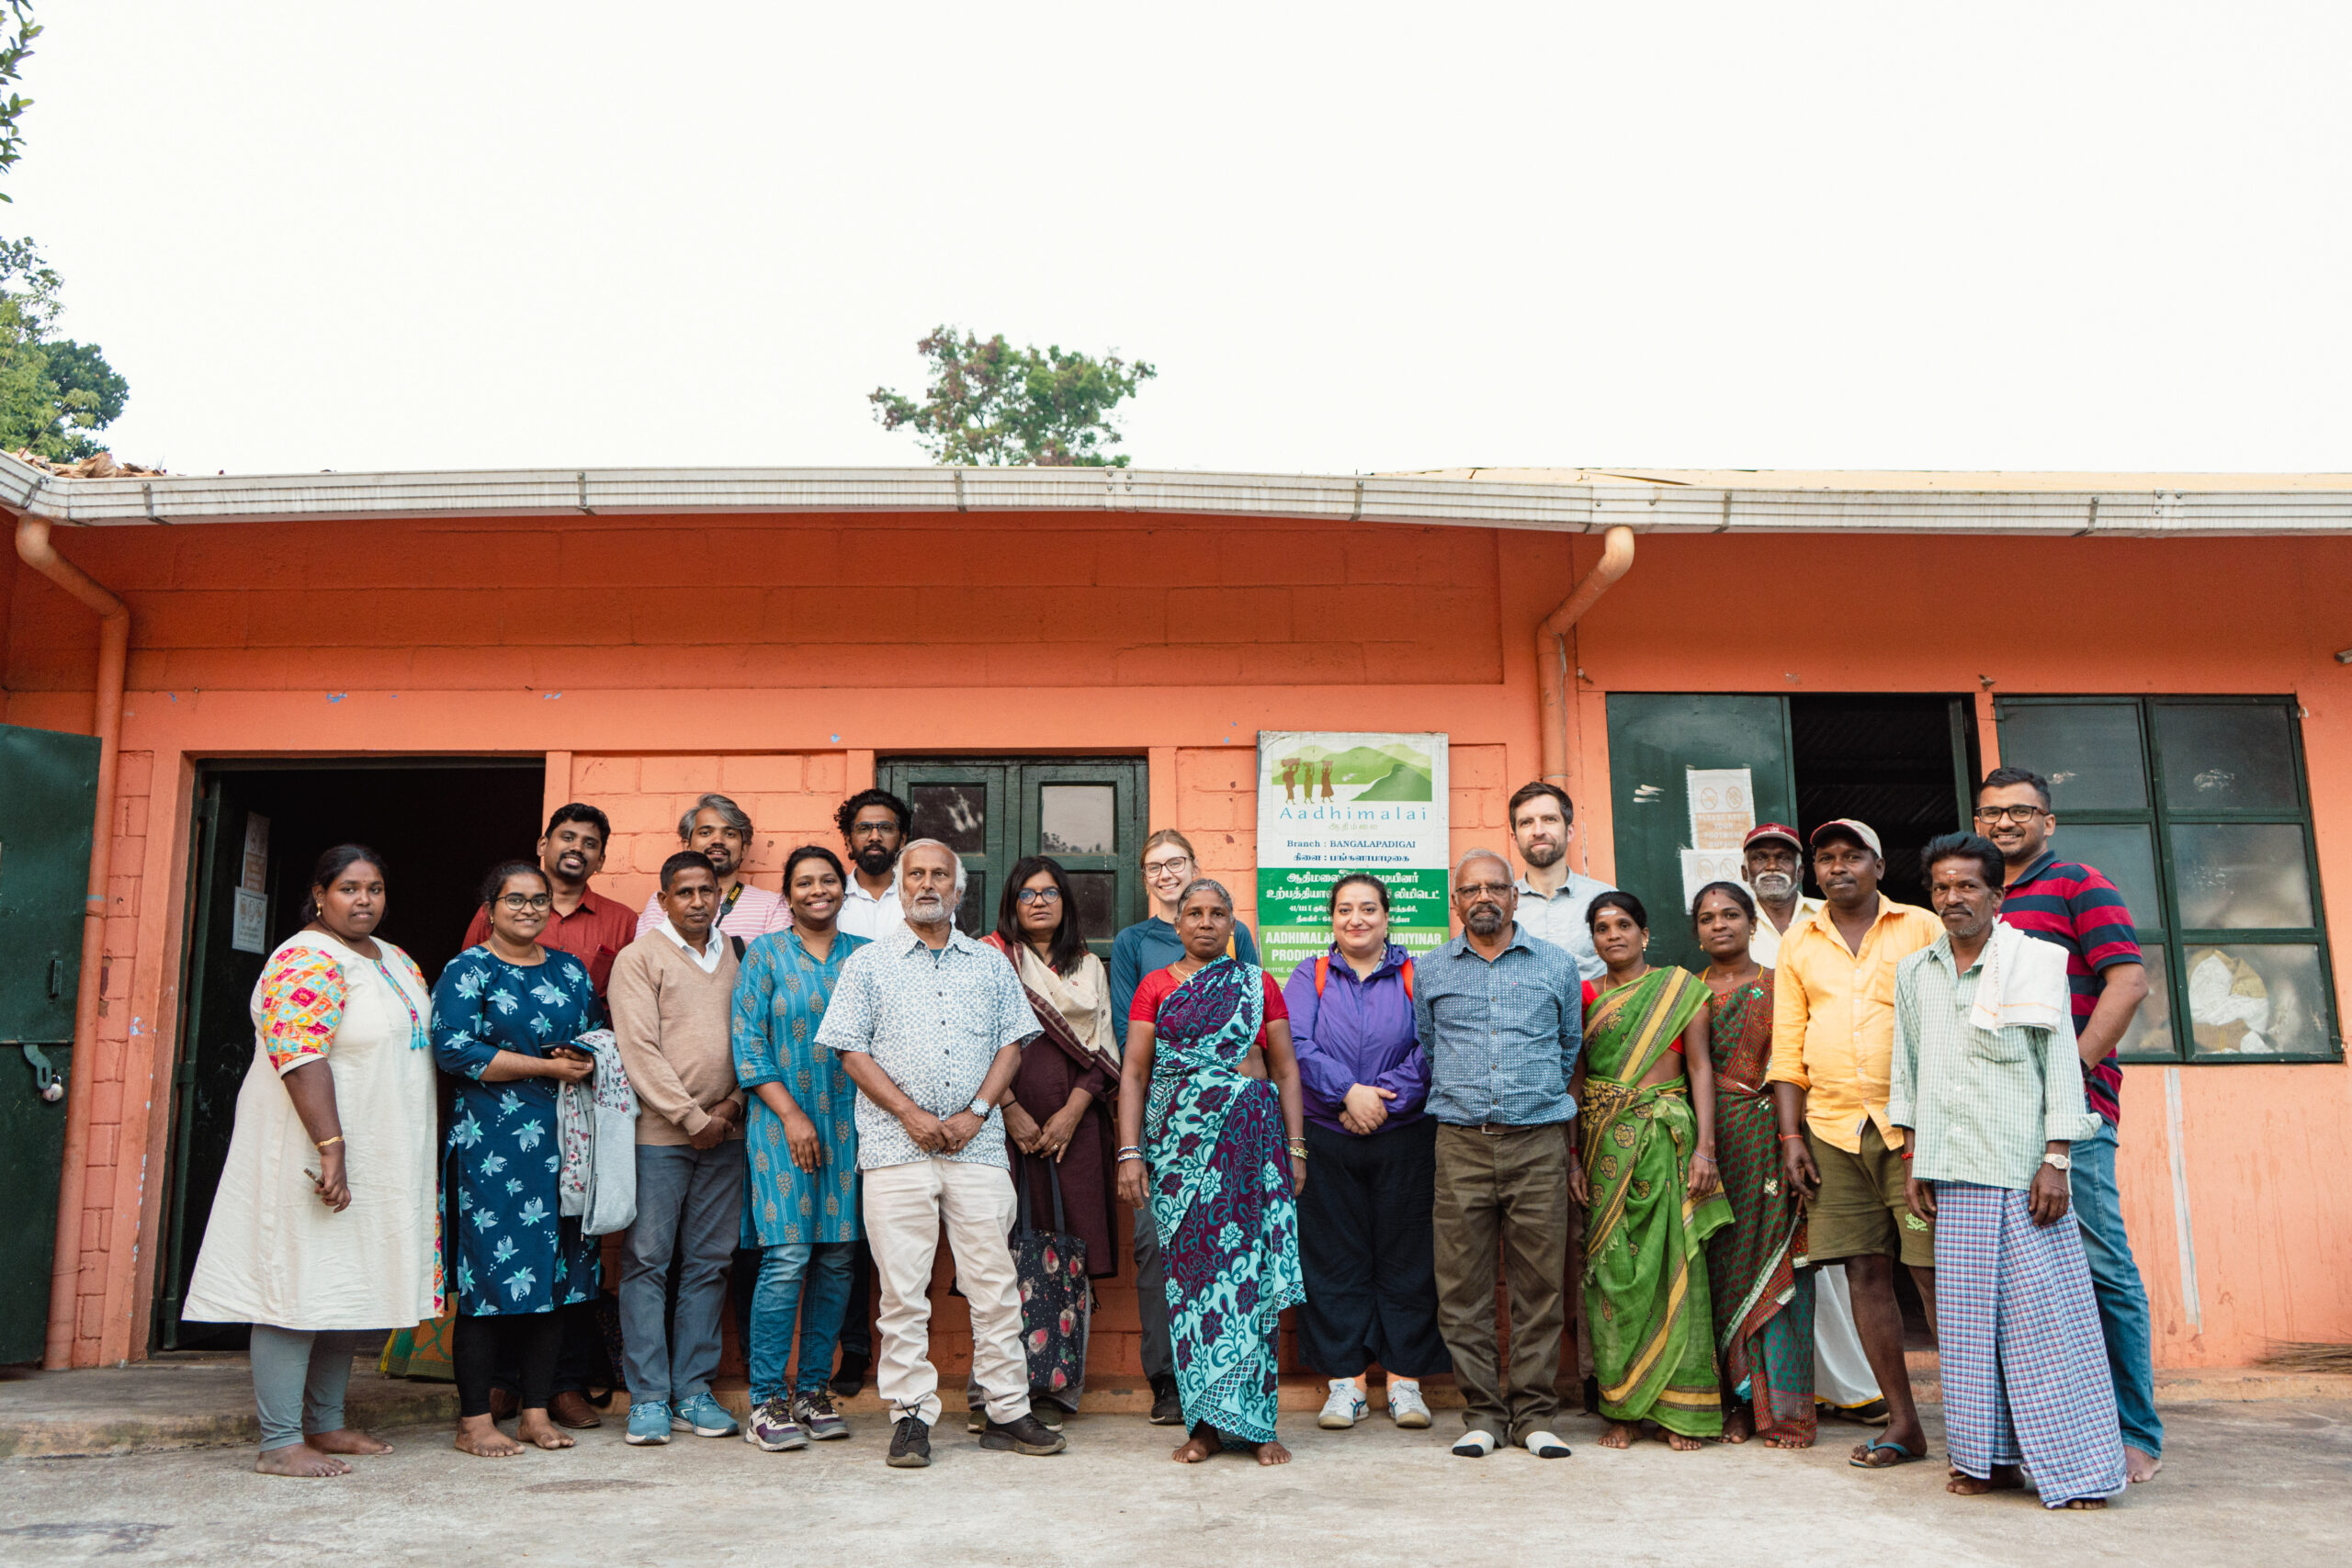
The first Field Trail with the research partner!
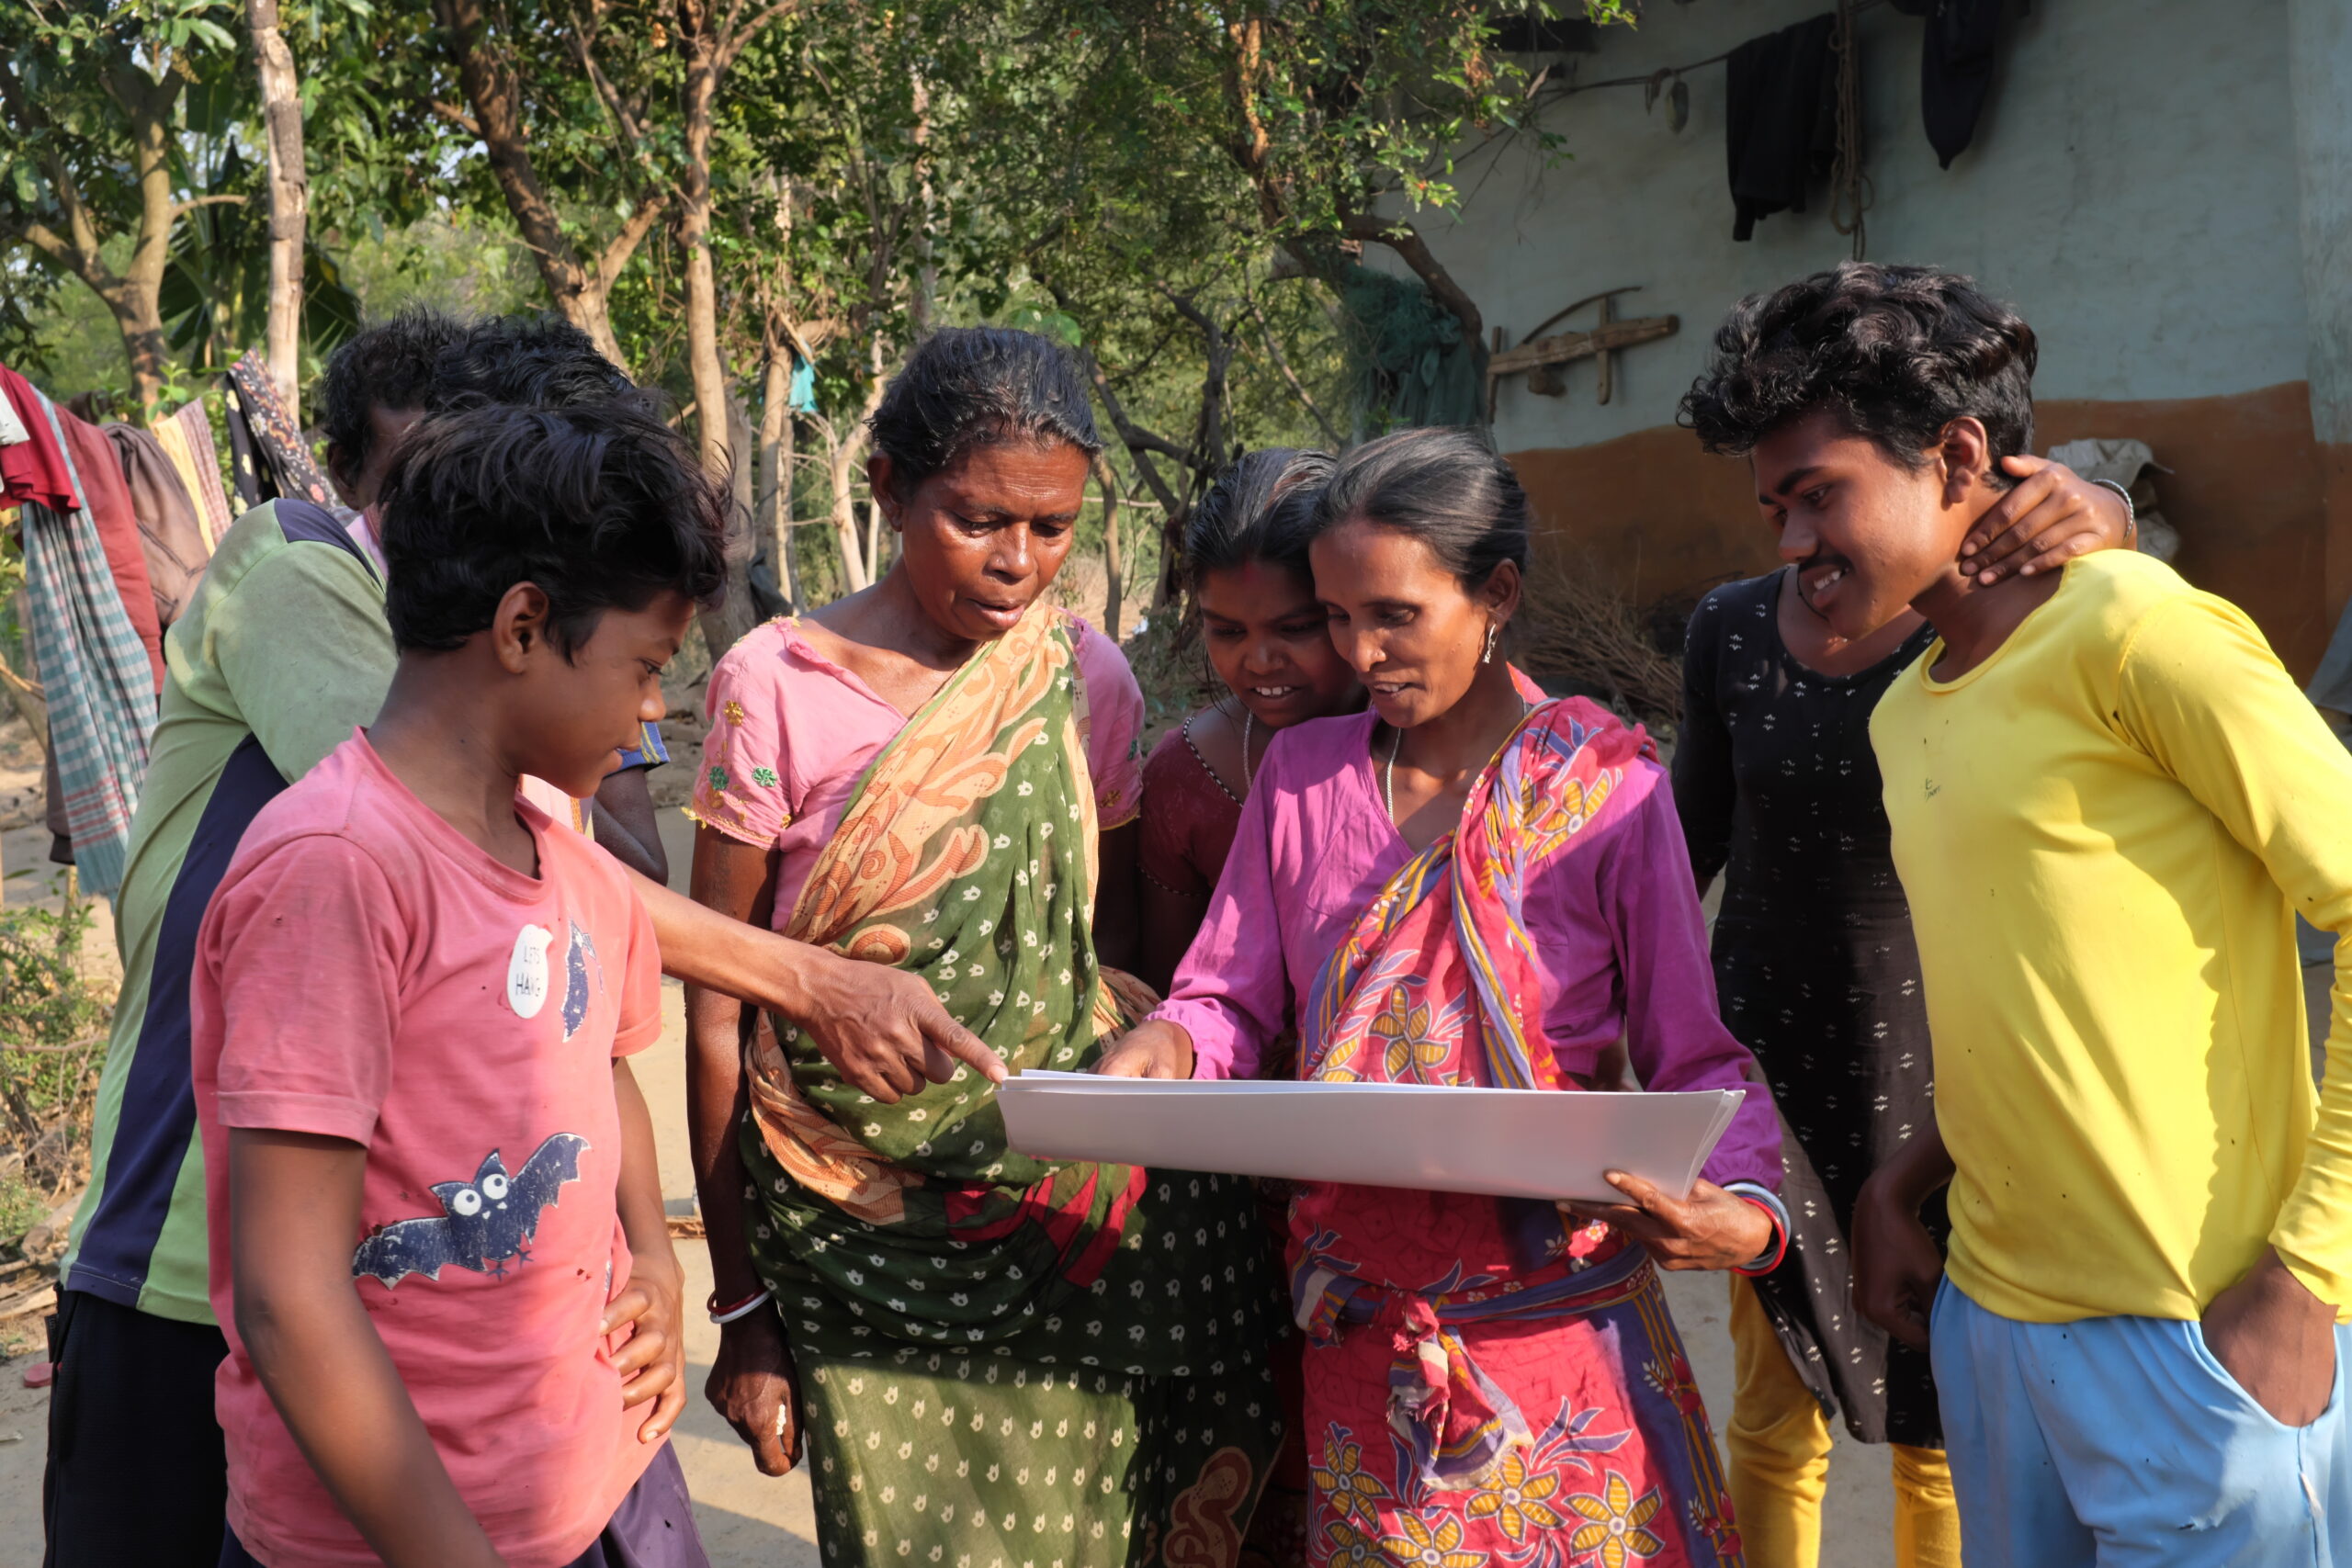
When the pre-set survey questionnaire was discussed in class, it was seen that certain concepts which seem simpler in English, got complicated and in-differentiable when translated into Tamil. For example, Keystone students felt that people would get offended if asked about their gender; also, there was no apt translation to question one’s marital status. Cornell students said it was challenging to conduct a survey using a foreign language for the very first time. Few of them expressed that they felt redundant during the survey, as they had to rely on translation given either by their research partner or a translator. In contrary, one Cornell student exclaimed how happy she was to meet many people and to hear about their everyday travel experiences from home to office. She mentioned that most of the women respondents found travel to be tedious mainly because of social reasons. A Keystone student was a bit confused when a respondent posed a question back by asking for examples.
What did staff at the organisation feel like to be interviewed?
A former NFLC student who is also a staff at Keystone noticed that the students were reading questions from questionnaire. She recalled her NFLC experience of developing good rapport with respondents by posing questions in a casual manner. An RJ from Radio Kotagiri said that the manner in which he was approached for the interview was more disciplined and he liked the idea of obtaining formal consent before interviewing a person. Unlike Census surveys where people are questioned only about number of members in a household, it was the first time for the gardener, the oldest person on campus, to be questioned about his educational status. “I studied till 12th grade in Ceylon” was his satisfied reply.
Getting an idea of what five weeks of research would be like.
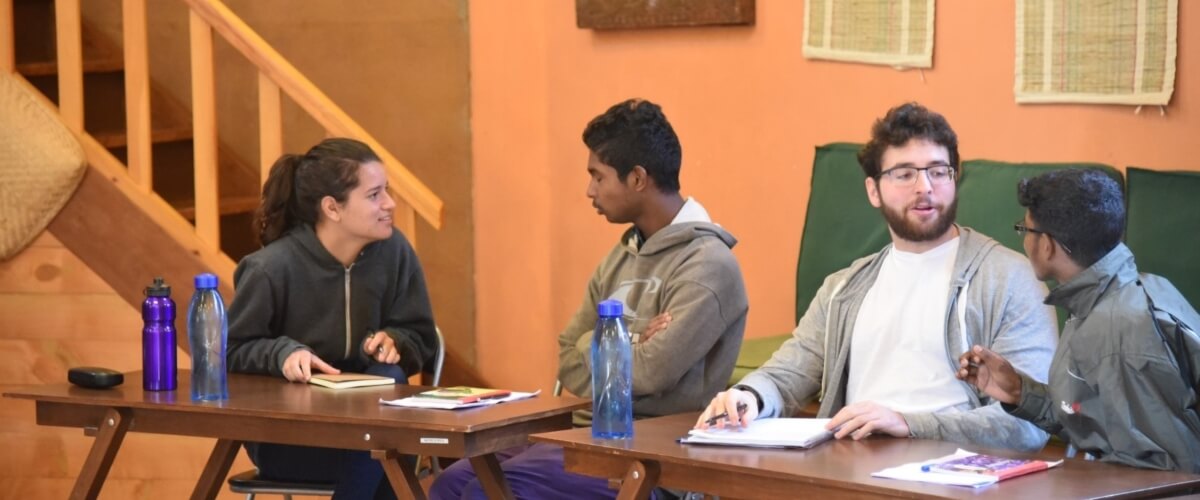
Post survey, respective research teams organised and cleaned their data. For many of the Keystone students, working with MS Excel was a new experience. “Her fingers moved swiftly on the keyboard while she was looking elsewhere” wondered a Keystone student at her research partner’s typing skills. One of the Cornell student mentioned that it was difficult to recollect her first laptop or Excel experience that would help her explain things at a pace suited to her research partner. “She clicks on one or two icons and results appear instantly. But, we are used to manual calculation and plotting on graph sheets.”
Despite the differences in levels of using different research tools it was interesting to see how each team ensured that their partner understood the implication behind every derived response and numerical value.
The teaching team also emphasised the real objective behind the survey – to prepare students to conduct research among large groups of audience; to stress the need to ensure feasibility of a perfect questionnaire both in English and local language; ways of framing questions, especially what/how to ask and what/how not to ask; to find a comfortable pace to work with research partners like – seeing variables together, use of google maps, etc.; to establish good rapport with respective translators. On the whole, this exercise helped each one to work in a team that included a student from indigenous community who have the experiential knowledge, Cornell students with academic exposure and a third role played by translator who was bilingual.